Details
Moving here from https://we.phorge.it/T15264 about debugging PHP 8.2 issues on Fedora 38 when setting up Phorge with an already existing older DB from Phabricator times on that machine.
For the records, I've had the following settings in /etc/php.ini:
error_reporting = E_ALL & ~E_NOTICE & ~E_STRICT & ~E_DEPRECATED
display_errors = on
log_errors = on
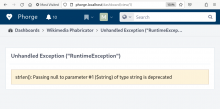
For errors still "within the Phorge UI" like
I could probably switch on Phorge's DarkConsole.
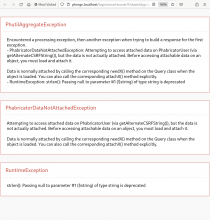
However, when I tried reaching my configuration settings to do so (by using a bin/auth recover link for the admin account), some PHP 8.2 issues I run into even block displaying the Phorge UI itself:
And nothing is reported into Apache HTTPD's /var/log/httpd/error_log either.
So I guess my question is: How to get a stacktrace?
As a hack, I changed a line in arcanist's src/error/PhutiLErrorHandler.php to make errors also output the file and line number to be able to locate the problematic line. But that doesn't sound like the best solution.
Answer Summary
Using Apache HTTPD as the webserver on Fedora:
- In the PHP config (on Fedora:/etc/php.ini), set
error_reporting = E_ALL & ~E_NOTICE & ~E_STRICT & ~E_DEPRECATED
display_errors = on
log_errors = on
- In Phorge, enable phabricator.developer-mode (via the web interface at /config/edit/phabricator.developer-mode/, or on the shell via /phorge/bin/config set phabricator.developer-mode true)
- If you use mod_php, by default stacktraces are in the Apache HTTPD error log (on Fedora: /var/log/httpd/error_log), or in the file defined as ErrorLog for the <VirtualHost> in your Apache HTTPD config (on Fedora: /etc/httpd/conf/httpd.conf)
- If you use php-fpm instead of mod_php, stacktraces are in the php-fpm error log (on Fedora: /var/log/php-fpm/www-error.log)
Answers
Using Apache HTTPD as the webserver on Fedora:
- In the PHP config (on Fedora:/etc/php.ini), set
error_reporting = E_ALL & ~E_NOTICE & ~E_STRICT & ~E_DEPRECATED
display_errors = on
log_errors = on
- In Phorge, enable phabricator.developer-mode (via the web interface at /config/edit/phabricator.developer-mode/, or on the shell via /phorge/bin/config set phabricator.developer-mode true)
- If you use mod_php, by default stacktraces are in the Apache HTTPD error log (on Fedora: /var/log/httpd/error_log), or in the file defined as ErrorLog for the <VirtualHost> in your Apache HTTPD config (on Fedora: /etc/httpd/conf/httpd.conf)
- If you use php-fpm instead of mod_php, stacktraces are in the php-fpm error log (on Fedora: /var/log/php-fpm/www-error.log)
The trace should appear in your webserver's log... If it doesn't, something is really wrong (Maybe it just didn't flash the log yet? Or something else equally strange?)
Enabling phabricator.developer-mode and the darkconsole should also show the exceptions (unless the darkconsole itself is broken...)

